Report
Michigan
State Overview
Explore the drivers of ethno-racial wealth disparity in Michigan and evidence-based, state-level policy solutions for growing household prosperity in every community.
Overview
Household wealth is not equitably distributed across racial and ethnic groups in Michigan, and these stark wealth disparities have generational consequences for the economic stability and mobility of communities of color.
The key findings below shed light on the extent of these disparities and their drivers in the state.
Based on a holistic analysis of these drivers, Prosperity Now proposes policy recommendations that are specific to Michigan, providing targeted solutions to address the unique challenges faced by each community, ultimately fostering more equitable and inclusive solutions to bridge the racial wealth gap.
The Compass is a tool for advocates, policymakers, and legislators to guide each state, including Michigan, to a more equitable economy through evidence-driven, state-based solutions.
Key Takeways
Household wealth is not equitably distributed across ethno-racial groups in Michigan.
- Income is a very small contributor to racial/ethnic net worth disparities.
- Home equity is a large contributor to racial/ethnic net worth disparities.
- Savings are a very small contributor to racial/ethnic net worth disparities.
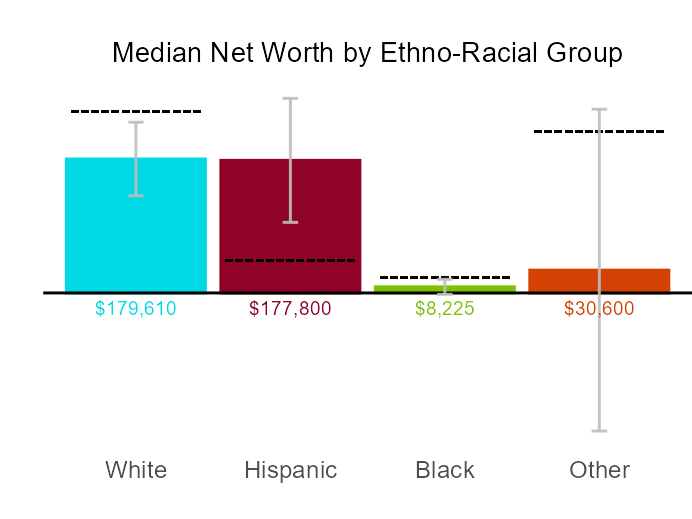
Source: Calculations using data from the 2022 SIPP survey.
Notes: The ethno-racial groups shown here are mutually exclusive and collectively exhaustive. They represent a combination of race and ethnicity of the head of the household rather than the entire household. Whenever a given ethno-racial group is too small for reliable statistical analysis, it is grouped with “Other” (see Methodology for more detail). The grey bars represent the margin of error around the estimated median. Wider bars mean that there is more uncertainty around the exact value of the median.
There are pronounced disparities in wages across ethno-racial groups in Michigan.
- Educational attainment is a small contributor to racial/ethnic wage disparities.
- Occupation is a very small contributor to racial/ethnic wage disparities.
- Employed hours are a medium contributor to racial/ethnic wage disparities.
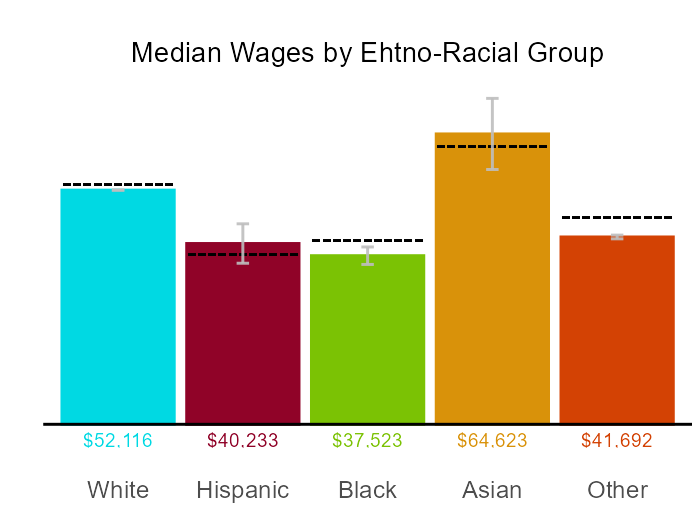
Source: Calculations using data from the 2022 ACS survey.
Notes: The ethno-racial groups shown here are mutually exclusive and collectively exhaustive. They represent a combination of race and ethnicity of the head of the household rather than the entire household. Whenever a given ethno-racial group is too small for reliable statistical analysis, it is grouped with “Other” (see Methodology for more detail). The grey bars represent the margin of error around the estimated median. Wider bars mean that there is more uncertainty around the exact value of the median.
Home equity varies significantly among ethno-racial groups in Michigan.
- Income is a very small contributor to racial/ethnic disparities in home equity.
- Bank savings is a very small contributor to racial/ethnic disparities in home equity.
- Non-home debt is a small contributor to racial/ethnic disparities in home equity.
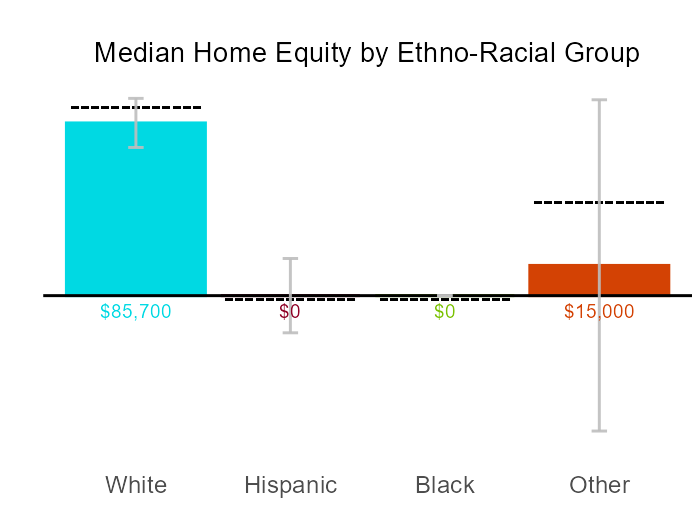
Source: Calculations using data from the 2022 SIPP survey.
Notes: The ethno-racial groups shown here are mutually exclusive and collectively exhaustive. They represent a combination of race and ethnicity of the head of the household rather than the entire household. Whenever a given ethno-racial group is too small for reliable statistical analysis, it is grouped with “Other” (see Methodology for more detail). The grey bars represent the margin of error around the estimated median. Wider bars mean that there is more uncertainty around the exact value of the median.