Net Worth
Net worth is the most common way to measure wealth. It is calculated by subtracting the value of household debt from the value of household assets.

Wealth and Net Worth
Prosperity Now’s analysis measures wealth through net worth. A complex interplay of assets, debts, income, and expenses affects household net worth, with each of these contributors influenced by its unique set of underlying drivers.
On this page, after picturing the state of the racial differences in net worth, we examine the underlying drivers of these inequalities.
There are stark differences in median net worth between ethno-racial groups in Michigan
This graph shows the differences in median net worth between white and non-white households. For example, the median net worth for Black households is about $171k lower than that of white households. By contrast, Hispanic households have about as much net worth as white households. Households from other ethno-racial groups have less wealth than white households, but the confidence intervals (represented by the gray horizontal bars) are too large to be able to make any definite conclusions.
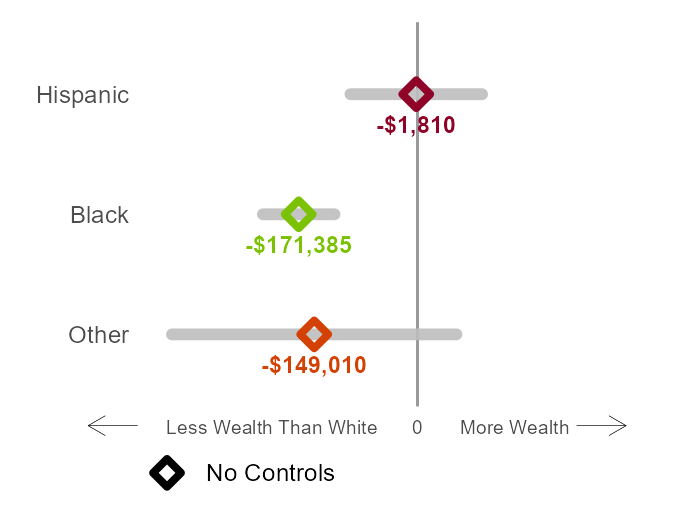
Source: Calculations using data from the 2022 SIPP survey.
Notes: The ethno-racial groups shown here are mutually exclusive and collectively exhaustive. They represent a combination of race and ethnicity of the head of the household rather than the entire household. Whenever a given ethno-racial group is too small for reliable statistical analysis, it is grouped with “Other” (see Methodology for more detail). The grey bars represent the margin of error around the estimated median. Wider bars mean that there is more uncertainty around the exact value of the median.
When comparing households with similar income, the net worth gap shrinks
Here we examine households with similar demographic characteristics and similar income. The squares in the graph below show the differences in median net worth when comparing households with similar demographics and income. For Black and other households, the difference from white households decreases. For example, when comparing households with similar characteristics and income, Black households have about $100,000 less in net worth, which is a smaller difference than about $171,000 when not comparing households with similar characteristics and income.
However, we should be cautious about drawing definitive conclusions from these figures. The confidence intervals for these estimates are quite wide, which means there's a lot of uncertainty around the exact numbers. In simpler terms, while we can see a general trend, the actual gap could be somewhat larger or smaller than what these specific numbers suggest.
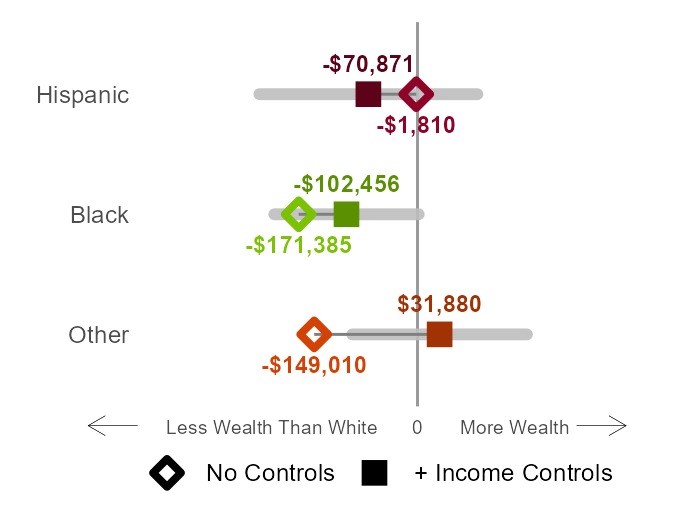
Source: Calculations using data from the 2022 SIPP survey.
Notes: The ethno-racial groups shown here are mutually exclusive and collectively exhaustive. They represent a combination of race and ethnicity of the head of the household rather than the entire household. Whenever a given ethno-racial group is too small for reliable statistical analysis, it is grouped with “Other” (see Methodology for more detail). The grey bars represent the margin of error around the estimated median. Wider bars mean that there is more uncertainty around the exact value of the median. The diamonds represent the differences in median net worth without taking other factors into consideration while the squares represent the model with the controls noted above.
When comparing households with similar home equity, the differences in median net worth are quite small
When we compare households with similar savings (and similar demographics and income), Black and other households have a median net worth that is closer to white households’. The squares below represent median net worth when comparing households with similar demographics, income, and savings. For example, when comparing households with similar savings, demographics, and income "other" households have about $17,000 less net worth than white households. When savings, income, and demographics are not taken into consideration, that gap is around $149,000. However, the confidence intervals are quite wide meaning there is a lot of uncertainty.
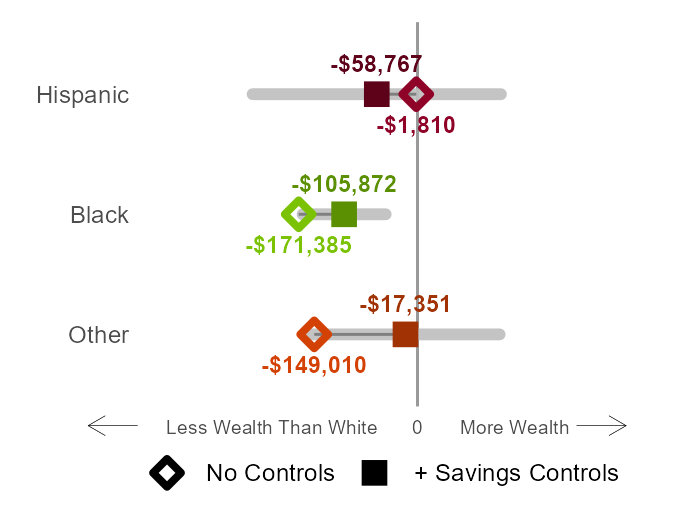
Source: Calculations using data from the 2022 SIPP survey.
Notes: The ethno-racial groups shown here are mutually exclusive and collectively exhaustive. They represent a combination of race and ethnicity of the head of the household rather than the entire household. Whenever a given ethno-racial group is too small for reliable statistical analysis, it is grouped with “Other” (see Methodology for more detail). The grey bars represent the margin of error around the estimated median. Wider bars mean that there is more uncertainty around the exact value of the median. The diamonds represent the differences in median net worth without taking other factors into consideration while the squares represent the model with the controls noted above.