
Overview
While we acknowledge that wages are not the only source of household income, we will here dive deeper into individual-level wages.
Wages from employment are the primary way individuals and households accumulate the financial resources to be able to both cover their regular expenses and purchase assets to build wealth.
Stark wage differences across racial/ethnic groups in Michigan
This graph shows the differences in median wages between white and non-white workers. For example, the median wage for Black workers in Michigan is about $15k lower than that for white workers. By contrast, Asian workers earn about $12k more than white workers. The small confidence intervals (represented by the gray horizontal bars) suggest we can be quite confident that the median wages for non-white workers are different from that of white workers.
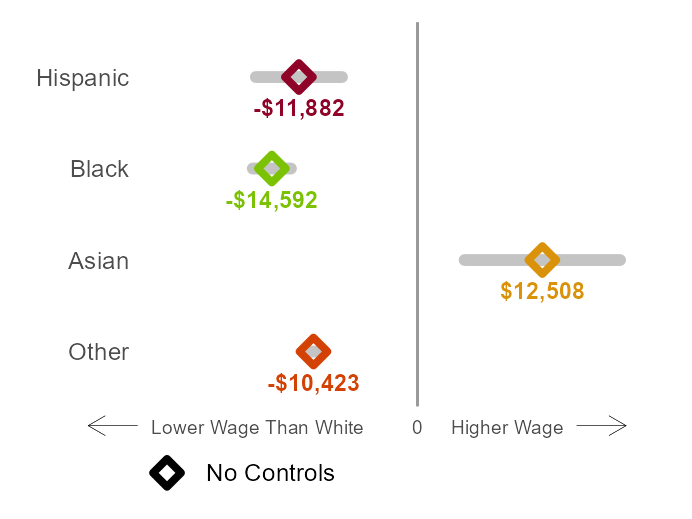
Source: Calculations using data from the 2022 ACS survey.
Notes: The ethno-racial groups shown here are mutually exclusive and collectively exhaustive. Whenever a given ethno-racial group is too small for reliable statistical analysis, it is grouped with “Other” (see Methodology for more detail). The grey bars represent the margin of error around the estimated median. Wider bars mean that there is more uncertainty around the exact value of the median.
Educational attainment disparities account for a substantial amount of the disparities in wages in Michigan
Here we examine workers with similar demographic characteristics and similar levels of education. The squares in the graph below show the differences in median wages when comparing workers with similar demographics and education. For Black, Hispanic, and workers from other ethno-racial groups, the difference from white workers decreases. For example, when comparing workers with similar characteristics and education, Black workers earn about $5,000 less in wages, which is which is three times smaller than the difference when not comparing workers with similar characteristics and education.
For Asian workers, when comparing them to white workers with similar demographics and education the difference disappears. When demographics and education are not taken into account Asian workers out earn white workers by about $13,000. But when demographics and education are taken into account, Asian workers earn about the same as white workers.
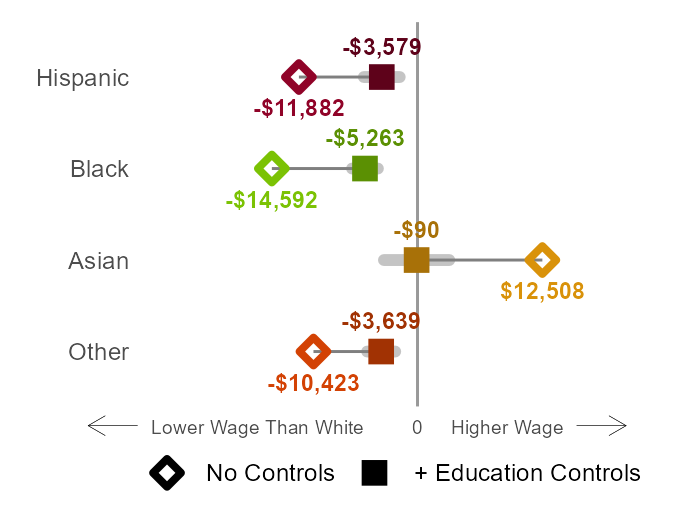
Source: Calculations using data from the 2022 ACS survey.
Notes: The ethno-racial groups shown here are mutually exclusive and collectively exhaustive. Whenever a given ethno-racial group is too small for reliable statistical analysis, it is grouped with “Other” (see Methodology for more detail). The grey bars represent the margin of error around the estimated median. Wider bars mean that there is more uncertainty around the exact value of the median. The diamonds represent the differences in median wages without taking other factors into consideration while the squares represent the model with the controls noted above.
Policy Recommendations
Quality early childhood education access
High-quality early childhood education (ECE) has the potential to improve academic performance and educational attainment and ultimately influence achievements and wages later in a child’s life.1 However, factors such as funding 2 and teacher quality3 for early childhood programs can exacerbate racial disparities if not distributed equitably.
Primary and secondary academic achievement
Academic achievement as early as primary and secondary education directly influences longer-term educational attainment. Racial academic achievement gaps are well-documented4 and set students of color, particularly Black students, up for less optimal workforce outcomes from an early age. Change can be propelled through state task forces or other state-level initiatives focused on racial equity in academic outcomes that set standards or goals for schools and teachers.
College and career readiness
An important aspect of promoting educational attainment is supporting the transition from secondary education to postsecondary education by exposing students early on to education and career steps, ultimately impacting wages and general success in the workforce. College and career readiness programs often target low-income, first-generation college students, which are disproportionately students of color.
Postsecondary education enrollment and completion
The disparities we see in educational attainment are due to both disparities in college enrollment5 as well as completion rates.6 In other words, not only do students need support in getting to college but also in making it to graduation. Barriers to enrollment and completion range from academic unpreparedness, to lack of information about the enrollment process, to prohibitive attendance costs, among others.
When additionally comparing workers with similar occupation, the gap in wages becomes quite small
Policy Recommendations
Affordable pathways to a variety of careers
Costs (both direct financial resources and the opportunity costs of training time) and lack of clear career steps can prohibit individuals of color from obtaining their career goals. Providing access to high-wage occupations for individuals of color requires comprehensive workforce development that covers both traditional college degree attainment routes as well as other certification and licensure routes. Under the federal Workforce Innovation and Opportunity Act (WIOA), states provide an array of employment and job training services through local “one-stop” centers. State Workforce Investment Boards have broad discretion in directing funding to their workforce centers and services, and in establishing the eligibility requirements to move through the sequence of services. States can prioritize training services in funding allocations and make it easy for individuals to move quickly through the sequence of services.
Diversity in STEM fields
STEM occupations present an opportunity for higher earnings as they tend to pay more than other occupations, yet Black and Hispanic workers are underrepresented in this field. These disparities start before the workforce, with differences in STEM degree attainment and majors while still in school.7
Differences in employed hours does not significantly affect the wage gap
Policy Recommendations
Pay for non-working time
Workers of color can be more susceptible to going through periods without pay. Due to things such as employer-based paid leave policies and occupational disparities, workers of color tend to have less access to paid leave through their jobs.8
Childcare access
Policies facilitating childcare access include sufficient public funding to make childcare affordable for all families, first and foremost for families struggling to make ends meet and those who report it the most challenging to find affordable, high-quality care–particularly Black and Latinx families. States can work toward guaranteeing universal childcare access by providing financial assistance based on family need. Increased access to childcare can impact the duration of labor force participation and employment.9
Unexplained differences
Workers of color of the same age, with the same marital and child status, with the same educational attainment, in the same types of occupations, and working the same hours still earn less than their white counterparts. Remaining disparities could be due to other influencing factors that we did not account for, such as the role of social networks in the job-search process,10 or due to discrimination and implicit biases in hiring and wage setting, 11 12 13 or a combination of both.
Policy Recommendations
Minimum wages
States and localities are empowered to index their minimum wage increases to keep pace with inflation and extend minimum wage increases to traditionally excluded workers like tipped, agricultural and domestic workers. Increasing the minimum wage from its low rate of $7.25 has the potential to decrease the racial wealth gap by boosting the incomes of many of the lowest paid Black and Latinx/Hispanic workers.14
Equitable wage setting
Many states have responded to ongoing challenges of equitable wage setting with specific bills related to salary histories, retaliation, and annual pay data reporting to help enforce equal pay practices and eliminate discrimination. Collective bargaining can also play a critical role in advocating for equitable wages for all employees.
Taxes
Tax systems can perpetuate disparities in wages. Particularly below the federal level, taxes such as property and consumption taxes tend to be regressive, requiring low- and middle-class households to pay a much higher proportion of their income than what wealthier households are asked to pay and disproportionately affecting households of color. Tax credits are one way to alleviate tax burdens on those populations.
Ability to unionize
States can expand collective bargaining for agricultural workers, domestic workers and other independent contractors who are excluded from federal protections. While states do not regulate collective bargaining for private sector workers, they can play a role in supporting efforts by unions in the private sector to promote good jobs. Governors and legislatures can use their executive and legislative powers to reverse any attacks that restrict public sector workers’ ability to bargain collectively for fair pay, benefits, and treatment on the job.
Pay equity, transparency, and wage history
Many states have responded to ongoing challenges of pay inequity with specific bills related to pay transparency, retaliation and annual pay data reporting to help enforce equal pay practices and eliminate discrimination. States can mandate equal pay across gender and race and prohibit pay secrecy practices in the workplace.
Other income sources
As seen in the data analysis throughout this section, workers of color tend to have lower expected wages either due to unemployment, underemployment, or simply working in jobs that do not pay well. Other income supports can help bridge some of those gaps when wages are not enough to cover living expenses, however they should not be taken as solutions to close the racial earnings gap by themselves.
References
- Georgia Family Connection Partnership. “Long-Term Effects of Early Childhood Education: Beyond Academics.” Georgia Family Connection Partnership, (2021).
- Babbs Hollett, Karen and Erica Frankenberg. “A Critical Analysis of Racial Disparities in ECE Subsidy Funding.” Education Policy Analysis Archives 30, no. 14, (2022).
- Latham, Scott, Sean P. Corcoran and Jennifer L. Jennings. “Racial Disparities in Pre-K Quality: Evidence From New York City’s Universal Pre-K Program.” Educational Researcher 50, no. 9, (2021).
- National Assessment of Educational Progress. “Achievement Gaps Dashboard.” The Nation’s Report Card. National Assessment of Educational Progress, (Accessed 2023).
- Reber, Sarah and Ember Smith. “College Enrollment Disparities: Understanding the Role of Academic Preparation.” Center on Children and Families at Brookings, (2023).
- National Center for Education Statistics. “Indicator 23: Postsecondary Graduation Rates.” Status and Trends in the Education of Racial and Ethnic Groups. Institute of Education Sciences, (2019).
- Fry, Richard, Brian Kennedy, and Cary Funk. “STEM jobs see uneven progress in increasing gender, racial and ethnic diversity.” Pew Research Center 1 (2021).
- Bartel, Ann P., Soohyun Kim, Jaehyun Nam, Maya Rossin-Slater, Christopher Ruhm and Jane Waldfogel. “Racial and Ethnic Disparities in Access to and Use of Paid Family and Medical Leave: Evidence from Four Nationally Representative Datasets.” Monthly Labor Review. U.S. Bureau of Labor Statistics, (2019).
- Kaugmann, Susan W., Sally Sharp, Jeanne E. Miller, and Jean Waltman. “Michigan: A Smart State for Women? Women and Higher Education.” Center for the Education of Women, University of Michigan, (2000).
- Pedulla, David S., and Devah Pager. “Race and networks in the job search process.” American Sociological Review 84.6 (2019): 983-1012.
- Bertrand, Marianne and Sendhil Mullainathan. “Are Emily and Greg More Employable than Lakisha and Jamal? A Field Experiment on Labor Market Discrimination.” National Bureau of Economic Research, (2003).
- Quillian, Lincoln, Devah Pager, Ole Hexel, and Arnfinn H. Midtboen. “Meta-Analysis of Field Experiments Shows No Change in Racial Discrimination in Hiring over Time.” Proceedings of the National Academy of Sciences of the United States of America 114, no. 41, (2017).
- Wilson, Valerie and William Darity Jr. “Understanding Black-White Disparities in Labor Market Outcomes Requires Models That Account for Persistent Discrimination and Unequal Bargaining Power.” Economic Policy Institute, (2022).
- Traub, Amy, Catherine Ruetschlin, Laura Sullivan, Tatjana Meschede, Lars Dietrich and Thomas Shapiro. “The Racial Wealth Gap: Why Policy Matters.” Institute for Assets & Social Policy, Brandeis University, (2015).